Previous page : Data analysis 1, linear relations, proportionalities, Zooming in
Next page : Data analysis, part 2, more linear Data
Zooming in, but not through the origin
This is continuing the analysis of the data in the Excel file Analysis 1-V4 , in the leaf The Data, 2 that we started to analyse on the previous page.
How about if we do not know it goes through the origin? We can then add points to the last column:
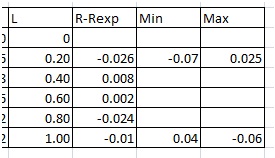
The values were chosen to make the slope as small or big as possible. The plot would now look like:
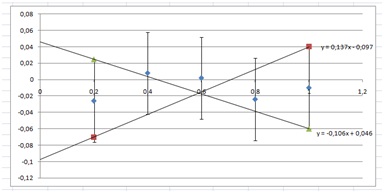
The slopes are 0.137 and 0.106. That gives us 0±0.2. The “y”-intercepts are 0.046 and –0.097, which gives us –0.03±0.08.
This will finally give us
R=(1.4±0.2)L –0.03±0.08
The difference between the two cases, the previous analysis and this one is whether you can assume it is a proportionality (goes through the origin) or not.
As you can see the result from this analysis is consistent with the result from the previous one, R=(1.41±0.05)L. The value zero is in the range –0.03±0.08, and 1.41±0.05 is within the range 1.4±0.2.
Previous page : Data analysis 1, linear relations, proportionalities, Zooming in
Next page : Data analysis, part 2, more linear Data