Previous page : s/t-graphs
Next page : Linear acceleration from 0
v/t-graps
Say we know how the velocity varies over time. We could show this using a v/t-graph with the velocity on the vertical axis and the time on the horizontal axis.
A graph like the one below would represent a constant velocity.
 In this case it indicates that the object has the velocity 6 m/s from the time 0 s to the time 7 s, i.e. for 7 seconds. We have that v=s/t. Multiplying both sides by t gives us s=vt. This means that the object moves s=vt= 6·7=42 m.
But wait a minute, that is the same as the area of the rectangle shown below.
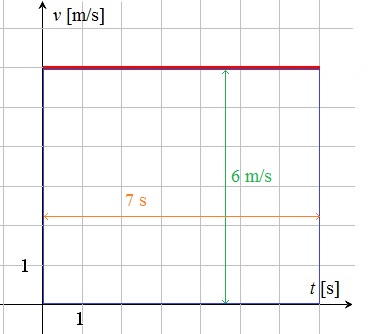
- In general we have that the displacement is represented by the area enclosed between the t0=start time, t1=end time, the v-graph and the x-axis. One often see this expressed as the dismantlement is the area under the curve.

(You could imagine splitting the area in lot of small rectangles, and each of them correspond to a time times a velocity, i.e. a displacement., and the narrower the rectangles are the better the sum of their areas correspond to the total area that then correspond to the displacement.
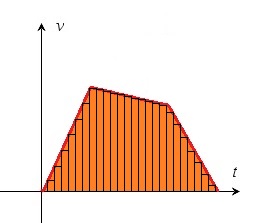 This is not how you in practice do it, but it shows that the area could in principle be seen as a sum rectangles, and thus as the sum of displacements.)
Let us now look at a slightly more complicated graph.
 From this we can see that the initial velocity is 0 m/s, then it increases over the next two seconds up to 6 m/s. It stays at 6 m/s for 6 s, then it decreases to 4 m/s over a time of 4 s, then it takes 2 s to go back to 0 m/s.
Acceleration
The change of velocity over time is called acceleration . We have that the average acceleration is

- I.e. acceleration is the change of velocity divided by the change of time.
The average velocity over the first two seconds in the motion in our graph will thus be 6/2=3 m/s every second. I.e. we have changed the velocity by 3 meters per second per second. This is usually written as 3 m/s2 or 3 ms–2. (The minus because a–n=1/an. )
For a straight line in a v/t-graph the acceleration = the slope of the line due to the definition of the slope. We will thus have that the acceleration is 3 m/s2 at any moment over the first two seconds.
From t=2 s to t=8 s the object remains at 6 m/s and the acceleration is thus 0 m/s2 and the slope of the line is 0.
From t=8 s to t=12 s the object is slowing down from 6 m/s to 4 m/s. This will give us an acceleration of

The acceleration is thus calculated as change in velocity = end velocity – start velocity, divided by the change in time = time in the end of the interval – time at the start of the interval.
An acceleration of –0.5 m/s2 means that we slow down by 0.5 m/s every second.
A negative acceleration is often called an retardation and sometimes deceleration.
Previous page : s/t-graphs
Next page : Linear acceleration from 0