Previous page : v/t-graphs and acceleration
Next page : Formulas for the displacement, starting at zero velocity
Starting at zero velocity
A common situation is that we start at the origin, and with the velocity 0. We then accelerate with a constant acceleration. The graph of that would look something like this:
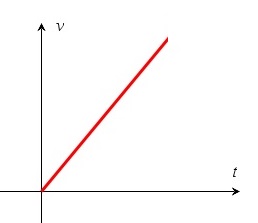 I have by purpose not added any units or scale because this should represent an acceleration from 0 in general.
We have that a=v/t.Multiplying both sides by t gives us the that the equation of the line above is v=at.
Let us say the acceleration is 2 m/s2, then a table of how the velocity change of the first 10 second would be:
| t [s]: | v [m/s]: |
| 0 | 0 |
| 1 | 2 |
| 2 | 3 |
| 3 | 6 |
| 4 | 8 |
| 5 | 10 |
| 6 | 12 |
| 7 | 14 |
| 8 | 16 |
| 9 | 18 |
| 10 | 20 |
So every second the velocity increase by 22 m/s. Below we have a graph of this acceleration.
 So how far has the object moved over 1 seconds? The area under the curve is the area of the triangle with the corners at (0, 0), (10, 0) and (10, 20), that is, the triangle framed by the read line and the thicker gray lines. Since the area correspond to the displacement we get

Previous page : v/t-graphs and acceleration
Next page : Formulas for the displacement, starting at zero velocity