Previous page : Data analysis, part 3, non linear Data
Next page : How to make a nice graph
Errors on both variables
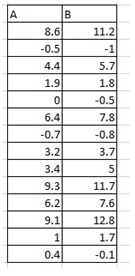
In most cases, you are in control of one of the variables. You may for example be able to choose the input voltage with high accuracy. In some cases though, both of your variables may vary, or be hard to set to the same value again. In those cases you need to estimate the errors in some other way than calculating them using the standard deviation. Let us say we have made the following measurements, where the errors in A are assumed to be ±1.2 units, and in B, ±0.8 units
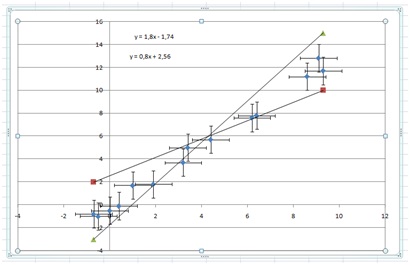
Plotting this, including error bars (of fixed lengths given above) would first give us:

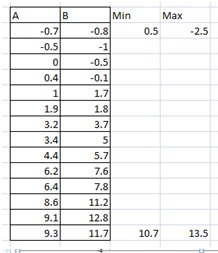
Next, we add two columns to enable us to get lines of min and max slopes. We also sort the data with the values in the A column going from the lowest to the highest. Don’t forget to also select the B columns as you sort the data.
You should now have something like:

You can draw a completely new graph, or add the values to your graph by selecting the points (left-click) then right-click, and add data, then add the Min data. Write “=” then mark the column from the -0.7 to the 9.3. For the “y“-values select the Min column from the 2 to the 10.
Then add another series in the same way, but use the Max column. Now after adding trend lines, we get:
Next, we tweak the values to fit the data as well as possible. It is often not a good idea to try to fit through all the error bars for single points. This would make the final errors too small. Try instead to cover the data and error bars in some “reasonable” way. It is also often a good idea to try to make the lines cross somewhat in the middle of the data set.
Using these values:
I got this:
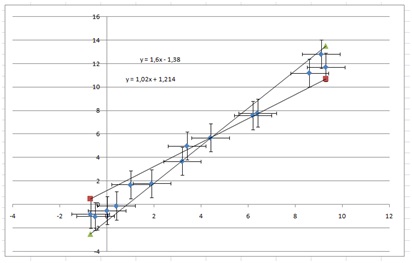
This looks somewhat reasonable. Using those lines we have a slope of 1.3±0.3, using the methods from the previous papers. We get a “y”-intercept of –1.30±0.9.
This would finally give us
B=(1.3±0.3)A –1.3±0.9
Previous page : Data analysis, part 3, non linear Data
Next page : How to make a nice graph