Previous page : Random variables
Next page : Standard Deviation and Variance, a first look
The Mean or average
The mean or average as it is also called is one of several measures of a centra tendency of some statistical data. It is basically the sum of the outcomes divided by the number of experiment.
As with most parameters in statistics the mean comes in different flavours. We have
- The experimental mean
Say we have done n stochastic experiments of the same kind then we calculate the experimental mean as
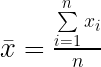
Here the indexed x’s are the results of our n experiments. We usually denote a mean of a variable by adding a bar above the variable name. We also usually write

Implicitly indicating a sum over all x.
If each outcome has happened a number of times, and we have organized it in a frequency list, i.e. a list of the outcomes and the number of time that outcomes has occurred, i.e. the frequency, then we get the formula

- The theoretical mean or expected value
The experimental mean is expected to vary from one sequence of experiment to another, but we expect the value of the experimental mean to approach some value as we add more and more experiments. If we have such a value we call it the theoretical mean or the expected value of the experiment. If we have a finite sample space of equally likely outcomes, then the theoretical mean is

Here the sum part stands for the sum of all the values in the sample space, and n is the number of elements in the sample space.
(The expression E(X) is probably a more common way to write the theoretical mean than 
Now suppose we have the possible outcomes in a frequency list, then, as with the experimental probability, we get

Now the indexed non capital x’s takes on all the possible outcomes.
But the frequency divided by the total number can be interpreted as a probability. That gives us the formula

Let us look at the example of the marbles in an urn, with marbles marked with numbers, four with a 1, three with a 2, two with a 3 and one with a 4,
We thus get the frequency and probability table
| x | f | P(X=x) |
| 1 | 4 | 4/10 |
| 2 | 3 | 3/10 |
| 3 | 2 | 2/10 |
| 4 | 1 | 1/10 |
We get the expected value

This could equally well have been calculated using the probabilities

Observe that the expected value is not necessarily a value we can actually get. If we for example look at a fair six sided ordinary dice, we get

The expected value is the expected average.
Previous page : Random variables
Next page : Standard Deviation and Variance, a first look