Previous page : Functions
Next page : Some definitions regarding functions
The Graph of a Function
If we have a function 

We previously represented these by figures with arrows from the x to the y values in the pairs. This works for finite sets, but for functions with infinitely large ranges and domains it is simply not doable.
If the domain and range are both reals, or subset of reals (i.e. integers), one can often graphically show the graph, hence its name. The graph could form a curve (but not all functions are curves, and all curves are not functions). One possible way to visualize the graph of y=x2, in an interval close to x=0 could be looking something like this:
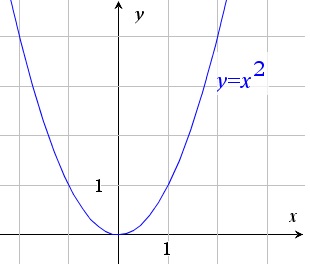 In this case we use a Cartesian orthonormal (or orthogonal) coordinate system, i.e. a system where the value of x is represented by the distance along one axis, usually the horizontal axis, and the value of y by the distance along a vertical axis, the axes being perpendicular (90o to each other) and in this case drawn to the same scale.
This is not the only possible representation. Using another coordinate system, e.g. one where the axes are not perpendicular would give us another shape of the curve.
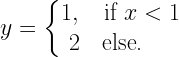
If the curve has steps, one can mark witch of the two possible values of the function is valid by marking it by a point, and by marking the other point by an unfilled circle. The function
would then look like
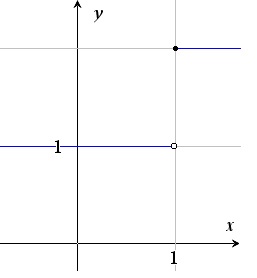
When the line just stops “mid air” then it indicates that it continues in some way.
A graph, in the sense of a set of points in a diagram, is simply a way to represent the set of ordered pairs that correspond to our function – or rather, the function is the set of ordered pairs, and that say may be shown in a graph. We thus have that

I.e. the relation (and in this case function) y=x2 is identically equal to the set of ordered pairs of a real number and its square.
Previous page : Functions
Next page : Some definitions regarding functions